Is the Arctic's biggest ice sheet in irreversible meltdown? And would we know if it were? Alexandra Witze reports.
 I. JOUGHIN
When people talk about catastrophic climate change, there's a fair chance that Greenland is on their mind. If they use the term 'tipping point', then it is pretty much a sure thing. One-twentieth of the world's ice is locked up atop that island, and if it were to melt completely, global sea levels would rise by seven metres. The collapse of the Greenland ice sheet is in the front rank of potential climate catastrophes.
Melting is already undoubtedly and dramatically underway. Glaciers are spitting icebergs into the ocean and scurrying back up their narrow fjords like rats up drainpipes. Giant lakes are forming on the frozen surface, sending torrents of water plunging through fissures in the ice sheet and thus, perhaps, accelerating its slipping and sliding seawards. Over the past four summers, Greenland has shed an average of between 380 billion tonnes and 490 billion tonnes of ice each year — on average 150 billion tonnes more than it gains in snow in winter.
That's a lot of water. It is not, as yet, a lot of Greenland's ice, which totals 2.9 million cubic kilometres. Such size brings with it an inherent sense of stability. We do not expect things bigger than mountain ranges just to go away. But there's a disturbing sense in which Greenland shouldn't be here in the first place. It is a holdover of the most recent ice age, a creature of conditions that no longer apply. No ice sheet would grow in Greenland if the current one were to vanish — even without human-induced warming, the climate would not allow it. The ice is a relic, stranded out of time. And relics are fragile.
The question is, how fragile? Has the warming the sheet has experienced so far and the further warming already in the pipeline enough to push the ice sheet past a point of no return1? If that is not yet the case, how far from that threshold are we? And if the sheet does start to go, how fast will it do so? The sheet will not vanish tomorrow, nor in a century — but assumptions that such processes take millennia are being reexamined on the basis of the changes already seen. The most recent synthesis report from the Intergovernmental Panel on Climate Change notes that the changes seen in Greenland today are not fully factored into the estimates of sea-level rise given in earlier science reports from the panel — a note that those who see Greenland as a potential poster child for catastrophe have made much of.
As yet, these pressing questions simply cannot be answered. They require models and theories not yet fully developed. And that lack of development is in part a lack of data — good data that show clear trends. Even though researchers scatter themselves around the island every summer to try to capture the meltdown's extent and processes, there is no systematic, long-term, broadly based monitoring of the sort needed to produce a truly comprehensive account of what is happening with the ice sheet. “Do we have the data we need to understand what's driving these changes?” asks Ian Howat, a glaciologist at Ohio State University in Columbus. “The answer is definitely no.”
The gravity of the situation
To get the best overview of the great Greenland meltdown, you need to go to space and look for gravity. The Gravity Recovery and Climate Experiment (GRACE) is a pair of US–German satellites that orbit Earth 500 kilometres up, one close behind the other. Through constant interchange of microwaves the satellites measure the distance between them very precisely, and that distance changes as massive objects below tug at the leader and the follower in slightly different ways at any given instant. The small discrepancies so produced can be used to calculate a gravity map for the planet. As masses move around, that map will change.
“2007 was a shocking year.” Scott Luthcke
Data from GRACE have revealed how the water flow in the Amazon basin changes with the seasons, and which Asian aquifers are replenished by the monsoons. The mission has also provided new information about the flow of water off the massive ice sheets in Greenland and Antarctica. “When you look at a lot of the insight we have” about Greenland, says Konrad Steffen, a glaciologist at the University of Colorado at Boulder, “it's GRACE.”
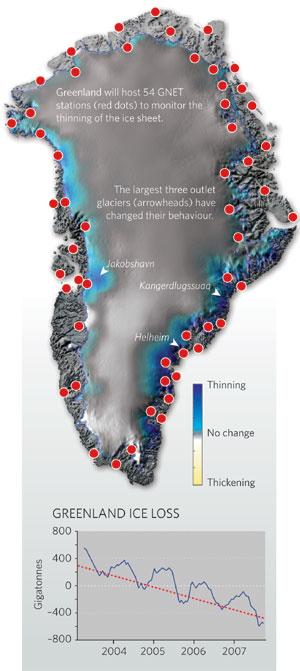
The estimates vary as to how much mass is lost through melting each summer. Isabella Velicogna of the University of California, Irvine, leads a group that takes a large-scale approach2, averaging the global gravity numbers provided by GRACE for each 30-day period. Her latest estimate suggests that 211 billion tonnes of ice are being lost each year, mainly from southern Greenland. “There is no doubt that things are changing faster than we expected,” she says. Meanwhile, Scott Luthcke of NASA's Goddard Space Flight Center in Greenbelt, Maryland, takes a different tack, using the changing distance between the satellites to calculate the pull of smaller mass concentrations on the ground over time3. Including the 2007 melt season, he gets preliminary estimates of 154 billion tonnes of ice lost per year. The numbers sound different, but both groups emphasize how close they are, and over time there seems to be some convergence. “These are two vastly different ways of processing data, and they're almost within the error bars,” says Luthcke. “Greenland is losing a lot of mass.”
GRACE is also providing clues as to how the situation varies from year to year — particularly for the last melt season, when surface temperatures were 4–6 °C higher than average and during which 500 billion tonnes of ice vanished. That's 30% more than the previous year, and 4% more than the previous record, set in 2005. “2007 was a shocking year,” says Luthcke. And GRACE's findings are bolstered by observations of dramatic ice losses by other satellites. Radar measurements, for instance, have shown4 that glaciers in southern Greenland are dumping ice into the ocean ever more quickly. At the American Geophysical Union meeting in San Francisco in December, Velicogna presented results showing that the GRACE estimates are supported by data taken from the Ice, Cloud and Land Elevation Satellite (ICESat), which uses a laser altimeter to measure elevation changes on the ice sheet.
An island rising
One reason for needing extra information to supplement the data from GRACE is the problem of "post-glacial rebound." As big as Greenland's ice sheet is today, in the ice age it was just a part of something far bigger, ice that reached as far south as the Ohio Valley and as far east as the Urals. That vast mass pressed the crust beneath it down into the denser mantle below. Although most of the ice has long since disappeared, large parts of the high-latitude crust have yet to recover from this repressed position. Scandinavia, for instance, rises 9 millimetres higher every year as the denser mantle pushes the lighter crust back up. This ongoing bounceback makes analysing the GRACE data harder.
Help may soon come from a system of global-positioning receivers that have just been installed around Greenland to measure how the bedrock is rising over time. Last summer, a team of researchers from the United States, Denmark and Luxembourg put 24 stations around the rocky, ice-free edges of the island — tripling Greenland's global positioning system (GPS) infrastructure in one field season, according to Michael Bevis, the project leader at Ohio State University. The Greenland GPS Network (GNET) is one of the northern components of a two-pole effort called POLENET to measure post-glacial rebound and other phenomena; there will eventually be around 50 GNET stations in Greenland. “We need much improved models of post-glacial rebound, otherwise GRACE measurements will have very limited value in Greenland and Antarctica,” says Bevis. “If we can pull this off, GRACE will become the most powerful system ever devised for measuring ice mass change.”
 NASA/GSFC Visualization Studio. Source: S. LUTHCKE.
The GNET stations are strung along the rocky margin of Greenland, mainly in remote areas (see map, above). They require a lot of battery capacity to continue operating throughout the winter months, and links to five of the stations installed last summer have already gone down. The team is planning to retrieve the data manually and fix the stations this summer.
All this makes GNET a fairly expensive proposition. The last field season consumed about US$1 million, and flat budgets, rising fuel costs and the weak dollar are making things even tighter this year. The rest of the GNET stations will have to go in over the next two summers instead of all in 2008, as originally planned.
The GNET receivers are expensive, highly precise, heavy and, in principle, durable. Another monitoring strategy takes the opposite tack; it uses GPS equipment cheap enough to lose, embedded at the calving fronts of some of Greenland's most active "outlet glaciers." These are the thick streams of ice that flow through narrow fjords into the oceans surrounding Greenland. A decade ago, researchers thought that these outlet glaciers moved slowly, creeping downward from the high centre of the ice sheet. In recent years, though, the glaciers have been doing a veritable hokey-cokey on their approach to the ocean, first advancing rapidly, then pulling back.
It started more than a decade ago with the biggest outlet glacier of all, Jakobshavn Isbræ on the west coast, which among its claims to fame is the most likely source of the iceberg that sank the Titanic . Between 1992 and 2003, Jakobshavn Isbræ accelerated from 5.7 kilometres per year to 12.6 kilometres per year5. “That was incredibly dramatic,” says Ian Joughin, a glaciologist at the University of Washington's Applied Physics Laboratory in Seattle. “A decade ago, nobody would have anticipated one of Greenland's biggest outlet glaciers doubling its speed.” Faster glacier movement means more ice dumped into the ocean, and a thinning of the central ice sheet from which the glaciers feed.
Over on the east coast, the island's other two big outlet glaciers also started speeding up6: Helheim in 2002, and Kangerdlugssuaq in 2005. The process didn't go smoothly. Helheim, for instance, retreated more than 3 kilometres between 2001 and 2003 as its front melted away faster than new ice flowed down to make up the difference. Then in 2005 it began advancing again as flow took over. This back-and-forth is captured most dramatically in remote-sensing images from satellites such as NASA's Terra and Aqua. “There is a lot of variability, and the important thing to remember is we only have a few good years of observations,” says Joughin. “We don't know if we are looking at the beginning of a longer-term trend.”
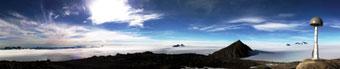 A GPS station, part of a network for measuring crustal movement. M. BEVIS
Joughin and others suspect that the back-and-forth of the outlet glaciers has a lot to do with the geometry of the fjords the ice squeezes through. The glaciers inch forward until their ends finally break off, calving icebergs into the ocean. This relieves stress on the glacier, which begins to surge, much as removing a buttress holding up a rickety old house will cause the house to collapse.
But the scenario is not as clear-cut as it might seem. In the past, glaciers advanced and then calved off icebergs when they got too long. Now, the calving happens while the glacier is advancing. What this means is unclear, but it does suggest that the glaciers are behaving in a fundamentally different manner than just a few years earlier. “This is what we cannot predict,” says Steffen.
But the unpredictable is not necessarily unprecedented. During the 1920s, Greenland experienced a rapid warm-up; average annual temperatures rose more than 2 °C over the decade. At Ohio State, meteorologist Jason Box and student Adam Herrington have been looking for records of what happened to the Big Three outlet glaciers back then, to see whether there are lessons about what to expect in the future. Among their finds was a series of maps showing the snout of the Kangerdlugssuaq glacier. Over just a few years in the early 1930s, the glacier retreated some 10 kilometres upstream — having lost an area up to 70 square kilometres in what may have been a single large calving event. The break-up, says Box, was “exceptional” in that the ice would have taken years to grow back to its previous state. And it suggests that the sort of rapid response to warming seen in recent years is the glaciers' expected response to warming.
One emerging area of research is the effect that ocean temperatures — as opposed to air temperatures — have on the outlet glaciers. Howat says, for instance, that warm ocean temperatures in the summer of 2003 coincided with a time when several of the outlet glaciers feeding into that warmer sea began speeding up dramatically. But little work has been done to correlate ocean temperatures with the glacier retreats. The ocean has been “a total blank spot on the map,” Howat says. “You have a big ice sheet with a lot of it sitting in the water — you'd think you'd want to know what's happening in the water.” Some researchers are starting to target this as their next area of interest.
Lakes on ice
The water that surrounds Greenland has been there forever. More novel is the increasing amount of water which, in summer, sits on top of it. What starts out in the winter as cold white snow ends up in the summer as a landscape of blue water, as more than 1,000 shallow melt lakes up to 5 kilometres across form on the ice. It is like Minnesota — but white.
“You have a big ice sheet with a lot of it sitting in the water — you'd think you'd want to know what's happening in the water.” Ian Howat
2007 was a particularly good year to study this surface melting, because there was a great deal of it. High-pressure weather systems throughout much of the summer kept storms away, allowed the Sun to beat down on the ice almost without cease. The melt season lasted 25–30 days longer than average, and 19,000 square kilometres turned from ice to water, says Marco Tedesco of Goddard — that is roughly the area of Wales. The effect was particularly noticeable at higher elevations; as warm air swept ever higher, the area that melted at 2,000 metres or greater was 150% larger than normal.
Even in a normal May to August field season, researchers have to make sure that their instruments stay anchored on the ice sheet, planting their poles 2–3 metres deep to make sure they can withstand the melt. It's not just the water that makes things difficult — it's the unpredictability. Melt lakes have been known to drain away tens of millions of cubic metres of water in the space of a day, swirling down some unknown drain channel in the ice. Huge waterfalls appear and then disappear overnight. How exactly the water gets from the top of the ice to its bowels isn't known, but understanding the plumbing could help illuminate a crucial question — does the water that reaches the bottom of the ice sheet lubricate it in a way that encourages movement and collapse7? This has become a commonplace speculation among Greenland catastrophists, but the degree to which it is actually happening, how well it explains the ice loss measured by GRACE and to what extent it may change the shorelines of the world is not yet clear.
Back to the Eemian
The suddenly apparent pace of change has led some to question previous, rather staid models of ice-sheet dynamics, which suggest that even fast changes take several centuries. “It has only been in the past five years that we have realized that hey, the ice sheet is falling apart, these changes are happening, our models are way off,” says Howat. But predicting how far off they actually are — and some believe they may not be as soon as catastrophists predict — is not easy. Anecdotes of this or that particular, however momentous, are no match for thorough, consistent monitoring. If you want models of the future you can rely on, you have to monitor the process you model. “The modelling has not happened because there are just not enough data,” says Philippe Huybrechts, an ice-sheet modeller at the Free University in Brussels. Researchers on the ice might see moulins forming, or outlet glaciers calving, but “it is just in one place and for one season, or for a few weeks,” he says. “To generalize from that over a whole ice sheet in a way that you can predict things, it's just not possible.”
At the moment, the best Greenland modellers are stretched by trying to explain what has already happened, without even thinking about what is to come. They are responsive, not predictive. But some are trying to change that. At the University of Kansas, Cornelis Van der Veen is helping to lead an effort to improve ice-sheet models; he and others are planning a major conference to be held in July in St Petersburg, Russia. The idea is to identify the big unknowns and figure out how to tackle them, one by one. “One outlet glacier speeding up isn't really the end of the world,” he notes. “But if they are doing that all over the place then that is an indication that something is going on that we really do not understand. It is not something that can be solved within a couple of months.”
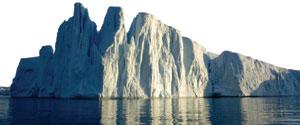 The calving rate of some Greenland glaciers has increased. J. BALOG/AURORA PHOTOS
“It's very difficult to model a new process, such as why glaciers accelerate, before you have an understanding of why it is happening,” says Dorthe Dahl-Jensen of the University of Copenhagen. “One thing is to observe it. The next step is to understand it. The third is to put it into the model and predict the future. We are at step two, struggling to understand the process.”
One route to understanding may be through palaeoclimate studies. Dahl-Jensen is leading a team that aims to drill a core 2,500 metres into the ice of northwestern Greenland over the next couple of summers. This core — the North Greenland Eemian Ice Drilling — would complement the pioneering climate records cored out of Greenland's ice over the past couple of decades. None of the earlier cores was able to extract an unbroken record of the Eemian stage, some 120,000 years ago and the last time that Earth was in a warm "interglacial" period. Understanding what Greenland was like then could help scientists understand how the ice sheet might respond in a warmed future, says Dahl-Jensen. Temperatures in Greenland were roughly 5 °C higher during the Eemian than they are today. Yet sea level was only one or two metres higher, and every ice core that has ever been drilled deep enough on the island has included some ice from the Eemian. “A major part of the Greenland ice sheet survived,” says Dahl-Jensen — and argues that more sampling of this period might help to pinpoint the factors that could allow ice to stick around when temperatures are higher than today.
“Every summer brings something totally different.” Leigh Stearns
But this is not necessarily the encouraging news it might seem. Because global warming is amplified near the poles, 5 °C of warming in Greenland might be achieved with just 2.5 °C of average global warming — which is quite plausible. And an important regional factor here might be the dramatic recent reductions seen in the sea ice to the island's north. The extent to which the cold, reflective ice on the sea keeps Greenland cool is simply not known.
The long view needed
More sampling of the past, together with that of the present, may help us to unravel the future of the Greenland ice sheet. For now, though, things seem to be getting more ravelled, not less. Every year brings a new set of data, a new insight into the behaviour of Greenland's interlocking ice-sheet dynamics, stream flows and glacial surges. “We are just learning so much,” says Leigh Stearns, a glaciologist at the University of Maine at Orono. “Every summer brings something totally different.”
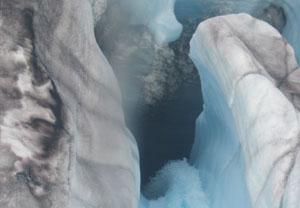 Melt water draining into moulins could accelerate the movement of the ice sheet. I. JOUGHIN
But if the learning is copious, it is not systematic. Despite the real risk of a meltdown — and the real benefits to be gained from being able to say something reliable about how long there is to go, and how high the seas might rise — the investigation of the ice's every nook and cranny is far from over. One idea is to use unmanned aerial vehicles (UAVs) to fly across the ice sheet gathering data such as the depths of melt lakes. But this is easier said than done; John Adler, a PhD student at the University of Colorado at Boulder, ran some tests last August in which he took three types of commercially available UAVs to Kangerlussuaq airport and ran flights over the melt lakes for a week. He is still getting the kinks out of the system, but says that UAVs could provide a cheaper and more repeatable way to get local measurements than relying on expensive helicopter flights, as is done today. Even so, the UAVs are labor intensive and cannot be operated all year round.
Over the long term, satellites should provide the most coherent record of change. The Terra and Aqua satellites, along with Europe's Envisat and other surface-monitoring satellites, are workhorses that regularly photograph the advance and retreat of outlet glaciers. Despite its glitches, the ICESat altimeter sends back elevation changes that track the thinning of the ice sheet; a successor, ICESat-II, is already in the works. And the European Space Agency is working to launch a successor to the ice-thickness-measuring CryoSat, the first incarnation of which failed after launch in 2005.
Yet major problems remain in acquiring and using Earth-observation data (see Nature 450, 782–785; 2007). Access to data from Canada's Radarsat-1 and Radarsat-2 for instance, is ensnarled in a potential takeover by a U.S. company, a sale that was blocked last week by the Canadian government.
Even with the right satellites, not everything can be done from space. Yet very few researchers have Greenland as the main focus of their scientific work. Decades from now, this could turn out to be one of the most short-sighted allocations of resources that began the twenty-first century. Climate change elsewhere in the Arctic has been swifter than anticipated. The remarkable shrinkage of the sea is “the largest change in Earth's surface that humans have probably ever observed,” Howat points out. Trying to get any and every handle on how that affects the poised mass of ice next door must surely be a priority, he says. “This should be a critical thing to study.”
See Editorial, page 781 . For a video of a camera being dropped down a moulin on the Greenland ice sheet, see http://tinyurl.com/5dua42
-
- Gregory, J. M., Huybrechts, P. & Raper, S. C. B. Nature 428, 616 (2004). | Article | PubMed | ISI | ChemPort |
- Velicogna, I. & Wahr, J. Nature 443, 329-331 (2006). | Article | PubMed | ChemPort |
- Luthcke, S. B. et al. Science 314, 1286-1289 (2006). | Article | PubMed | ChemPort |
- Rignot, E. & Kanagaratnam, P. Science 311, 986-990 (2006). | Article | PubMed | ChemPort |
- Joughin, I., Abdalati, W. & Fahnestock, M. Nature 432, 608-610 (2004). | Article | PubMed | ChemPort |
- Joughin, I. et al. J. Geophys. Res. 113, F01004 (2008). | Article |
- Zwally, J. et al. Science 297, 218-222 (2002). | Article | PubMed | ISI | ChemPort |


No comments:
Post a Comment