Cold Hard Facts
January 8, 2009 · 197 Comments
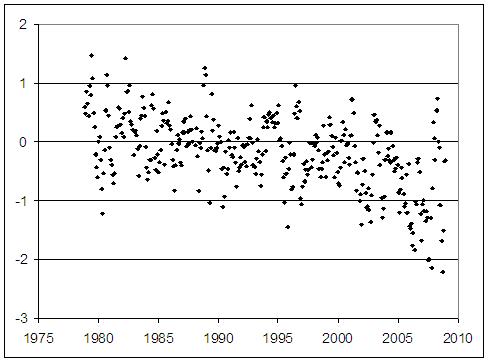
Suppose you needed to understand these data:

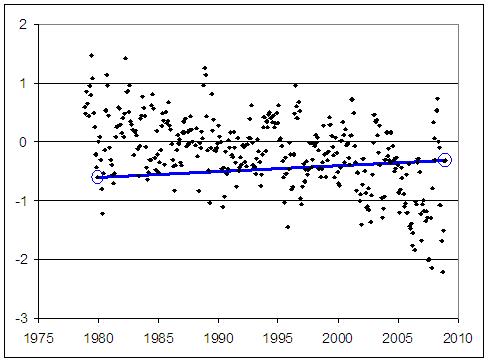
You’re especially interested in the trend present, so you can have some idea what to expect in the future. You suspect that there’s a downward trend (based on visual inspection of the data), but you’re not sure whether or not it’s significant, or whether the trend might be nonlinear, and you’re not a statistician. So you hire someone to analyze the data, who reports that the proper characterization of the long-term trend is summarized thus:

In fact, he flatly states that there’s no downward trend, as proved by the fact that the value for December of 2008 is about the same (a little bigger, in fact) than the value for December 1979. Then he presents you with a whopper of a bill for his services.
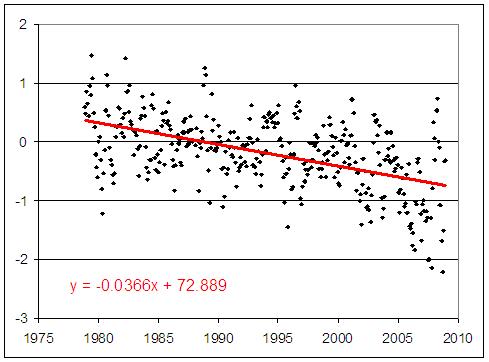
You protest. “That’s not a proper characterization of the trend over time! You’ve just connected two points, which only emphasizes the fluctuations that happen all the time, while ignoring all the other data! You’ve completely mischaracterized the real trend! I could’ve done a better job myself, just by fitting a trend line with ExCel!”

You’d be well advised not to pay for such analysis services. Characterizing the long-term behavior, and what might reasonably be expected in the future, in this way is — well — not smart.
But that’s the new meme du jour in the denialosphere. The headline is “Sea Ice Ends Year at Same Level as 1979.” It seems to have started with DailyTech, then got echoed by boingboing, and has been repeated by many (including here, here, and here). The data are global sea ice area anomaly from satellite measurements. You can see that there might be a downward trend, and any idiot (well, apparently not any idiot) can see that connecting two data points and drawing a conclusion about the trend, or what we might expect the future to bring, is … you get the idea.
Fitting a trend line (with Excel or any other software) is a much better way to characterize the trend. It turns out that the trend is statistically significant (strongly so), so we can conclude that global sea ice area has trended down in the 30 years it’s been monitored by satellites. In fact there’s evidence that the rate of decline has increased, so the downtrend is actually accelerating — but the evidence is not yet statistically significant. We can certainly expect the future to show further decline, and we shouldn’t be at all surprised if it declines even more rapidly than it has so far.
Time to get back to real science. It’s much more fun.


No comments:
Post a Comment