DE FREITAS FEEDS HIS STUDENTS SCEPTIC PROPAGANDA
 Auckland University associate professor Chris de Freitas has been caught feeding climate denier propaganda to first year geography students. A close examination of the student workbook for de Freitas’ lectures on climate for the University’s core first year geography course reveals that it includes material from sceptic blogs and US think tanks — even a misleading graph prepared by Christopher “Garnaut’s a Nazi” Monckton.
The NZ Herald‘s Chris Barton broke the story this weekend — first year geography students have complained that their climate lectures didn’t reflect what they were learning elsewhere in the university:
…according to some students of de Freitas’s 101 course on the basics of climate you won’t hear about how climate scientists are now seeing such patterns [of extreme weather]. Or about the building evidence that human-induced climate change is changing precipitation and the hydrological cycle, especially the extremes.And that 2010 ranked as the warmest year on record, together with 2005 and 1998, making the first decade of the 21st century the warmest ever according to the World Meteorological Organization. [...]“No, nothing,” a student in the course told the Herald. “I learned all that in my Environmental Science class.”The Geography 101 lecture workbook confirms the lack of such information. There seems little, if any, reference to the Intergovernmental Panel on Climate Change (IPCC) and its landmark 2007 reports were not listed in the course reading material. Climate scientists shown the workbook were surprised at how out of date much of the material was.
A glance at the lecture workbook, however, shows that de Freitas’ misdirection of his students goes much further…
The climate section of GEOG101 consists of eight lectures given by de Freitas. A copy of the workbook for this year’s autumn series, including one student’s annotations, can be download here (pdf, 6MB). Much of it is pretty straightforward stuff, primarily based on material from the two reference texts de Freitas recommends1. The student notes are interesting to scan, and highlight in several places apparent attempts by de Freitas to downplay CO2‘s role in climate change, and to play up ENSO as the cause of warming. More telling than the notes, however, is the selection of material de Freitas lines up for his last lecture: Natural climate variability and change [a higher resolution pdf of the notes for that lecture is available here (pdf, 6MB)]. A couple of the slides looked strangely familiar…
The last slide on the first page is credited to “Spencer 2008.″ It looks like this:
The original can be found as an illustration to an essay by prominent sceptic Roy Spencer titled Global Warming and Nature’s Thermostat,2 which seems to have been published on the web in early 2008. Spencer has taken a paleo temperature “reconstruction” by Craig Loehle3, and stitched it on to the Hadley Centre global temperature record. It’s about as far from the mainstream of paleoclimate reconstructions for the last 2,000 years as it is possible to be.
But it gets worse. The last two slides on the next page of the workbook pdf (p. 3 of the hi-res pdf, p. 62 of the low res) include little inset graphs. The first of these is a graph of monthly global satellite temperatures with the increase in CO2 overlaid, prepared by US weatherman and noisy climate denier Joe D’Aleo. The last slide on that page includes a little inset graph that looked familiar.
It took a little hunting, but I eventually tracked down the original4, from Christopher Monckton’s March 2009 SPPI Monthly CO2 Report at the web site of the Science and Public Policy Institute, the US lobby group that promotes many of Monckton’s activities:
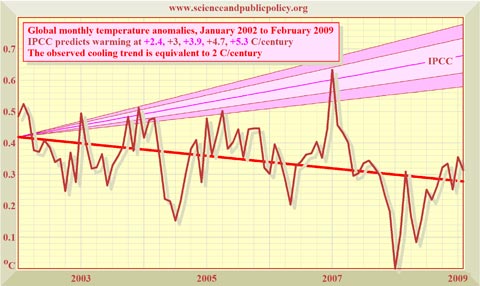
De Freitas is presenting material prepared by US lobby groups and bloggers — stuff that’s been deliberately designed to confuse the issue, not provide educational material for use in university foundation courses.
At no point in his lecture series does de Freitas use what might be called a mainstream paleoclimate reconstruction. Every slide he shows emphasises a Medieval Warm Period, and minimises current warmth5. He uses old, out-dated resources, as well as misleading stuff concocted by Monckton and Spencer. As Barton’s Herald article confirms, at no point does he bring the IPCC or current climate information into his lectures.
The other important piece of context for de Freitas’ behaviour is the people he is lecturing. They are first year geography students, probably 18–19 years old, fresh out of school. They are in their first term at university, and they are being badly misinformed by a senior academic at the university they are paying to attend. There is no attempt by de Freitas to “teach the controversy,” no attempt to present both sides of the debate sceptics like to insist still continues. Instead, he presents a partial picture that fits with his preconceived position. His students finish his course likely to believe that CO2 is not important, ENSO rules global temperature, the surface temperature record is unreliable and that current gobal temperatures are not all that warm. They have been grievously ill-informed.
This is not a matter of “academic freedom” — de Freitas is perfectly entitled to believe what he wants — but he should not be teaching foundation courses in climate that depend on the output of US lobby groups and far-right British politicians or are so far out of touch with the mainstream of the science he is purporting to present. His students deserve to learn the subject as we best understand it, not just the painted pig that de Freitas dangles in front of them. In the meantime, the University of Auckland has a problem. What price academic excellence, when you have an associate professor determined to ignore that fine idea?
- Strahler, A. and Strahler, A, 2005. Physical Geography – Science and Systems of the Human Environment, 3rd edition, John Wiley and Sons, New York; Smithson, P, Addison, K. and Atkinson, K., 2002. Fundamentals of the Physical Environment, 3rd edition, Routledge, London. [↩]
- Several other graphs in this section are similarly credited, and can be found on that web page. [↩]
- Loehle, C. 2007. A 2000-year global temperature reconstruction based on non-treering proxies. Energy & Environment 18(7-8): 1049-1058. Published in 2007, and heavily criticised at the time. [↩]
- There are some very minor differences between the two graphics, and CdF’s seems to have been taken from a printed source, but they are clearly from the same author [↩]
- Most of the slides look like they’ve been drawn from the IPCC First Assessment Report’s paleoclimate graph, itself based on one originally drawn by pioneer climatologist HH Lamb, perhaps as early as the 1960s, IIRC [↩]


No comments:
Post a Comment